RETURN TO MAIN PAGE
Ridership data overview
Transit agencies are required to collect and report data on ridership on a monthly basis to the Federal Transit Administration. This ridership data is used to track transit service performance, and affects the federal funding which agencies receive for operations.
RIDE maintains historical monthly data for RTA ridership by bus and streetcar line from January 2012 through February 2022. This data can be viewed using the dashboards below.
Beginning in January 2022, the RTA changed its collection methodology for reporting bus passenger counts. As a result, caution should be used when comparing bus passenger counts to counts collected before and after January 2022. Refer to the methodology notes below for additional information:
Explanation of RTA passenger count methodologies (click to expand)
There are two widely used methods for collecting and reporting bus passenger data which are permitted for federal reporting purposes. The first is farebox data, which tracks the number of passengers who get on a transit vehicle as recorded by the number of fares paid. The second is automated passenger count (APC) data in which ridership is recorded by devices installed on vehicles that track when people get on or off at each stop.
There are some important differences between APC and farebox data in terms of both the types of information collected and the methodology for collecting and processing counts. Notably, farebox data typically undercounts ridership and APC data typically (slightly) overcounts ridership. This is because farebox data will miss passengers who board without paying a fare, while APC data will also include boardings by non-passengers (such as drivers and agency personnel getting on and off the bus). The difference between reported farebox and APC counts is relatively large, with APC counts typically 20-30 percent higher than farebox counts.
When implemented correctly, APC data has the potential to be more accurate than farebox data and allows for more granular analysis, such as stop-level ridership patterns. However, APC counts require significant investment and technical capacity by transit agencies to install the devices and properly collect, validate, and process the count data. Consequently, an agency’s APC devices must be certified by the FTA before they can be used for federal reporting purposes.
Prior to 2022, the RTA reported both bus and streetcar counts using farebox data. Beginning in 2022, the RTA received FTA approval for its bus APCs and transitioned to reporting bus ridership data through APC counts, while continuing to report streetcar counts with farebox data.* As a result, monthly bus ridership totals from 2022 onwards are reported separately in the dashboards below from data in prior years. Due to the change in collection methodology, significant caution should be used when comparing bus passenger counts from 2022 onward to earlier data.
*Note: Streetcar APC devices are more difficult to implement because each RTA vehicle has five possible boarding locations (two at the front and back of each vehicle, plus the wheelchair lift on Canal streetcars) where devices must be installed and calibrated accurately to produce a full boarding count. In addition, the St. Charles streetcar currently does not have APC devices installed on most vehicles due to its historic landmark status.
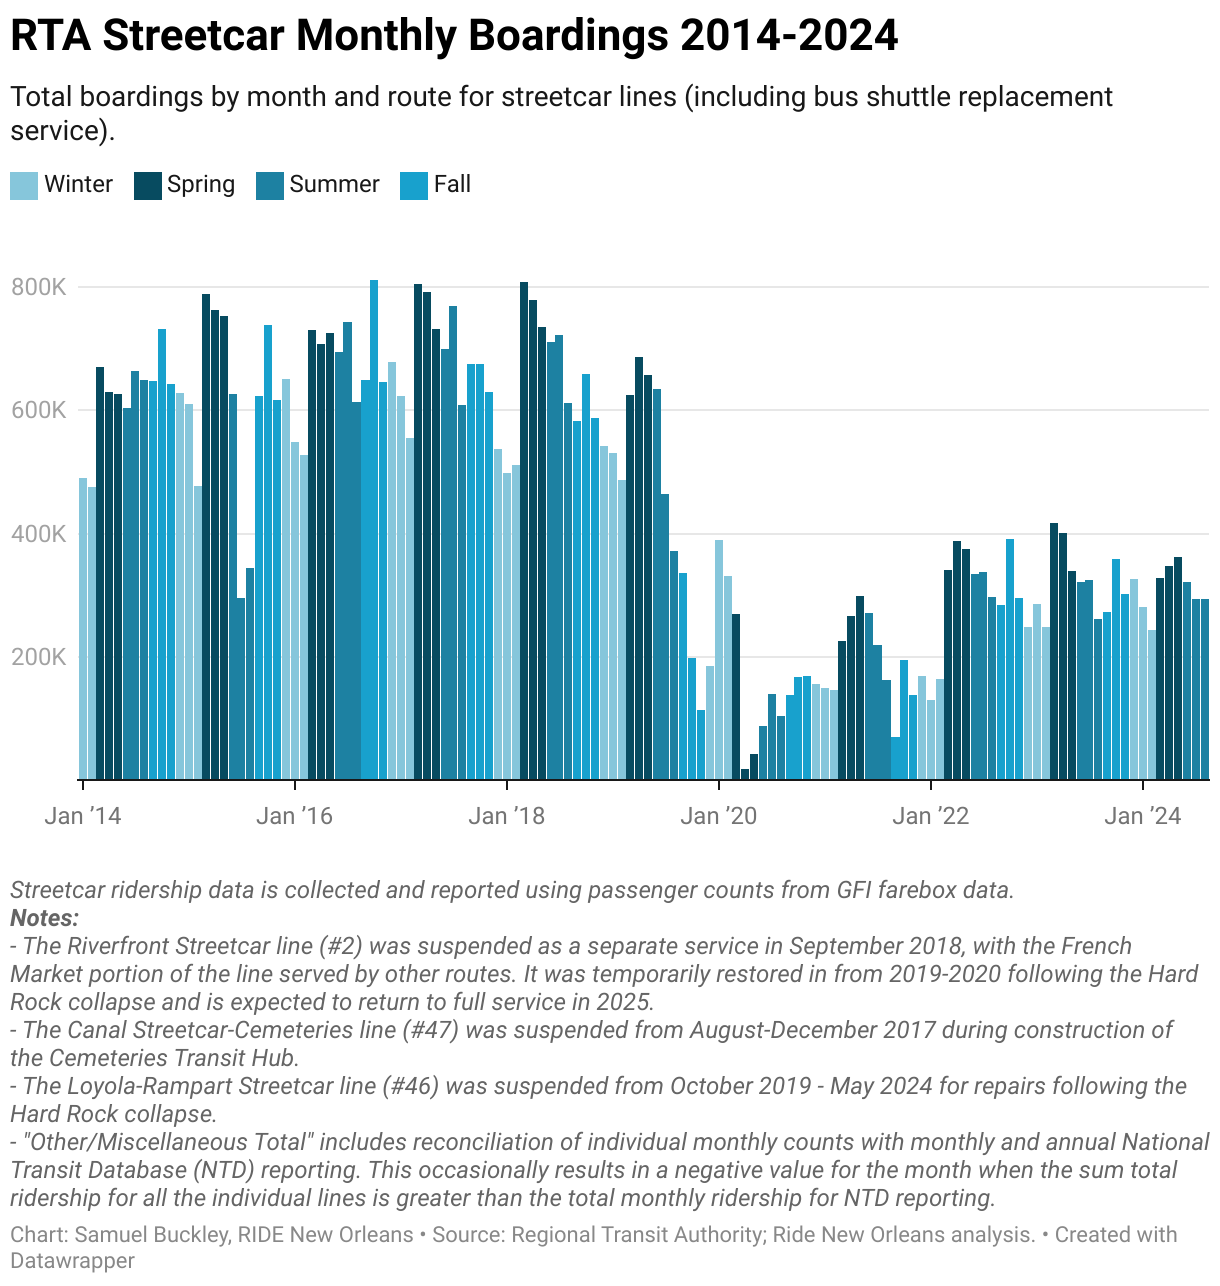
RTA streetcar boardings by line and month
Jan 2012 – Apr 2026 (farebox data)
Description: Total monthly streetcar boardings by line.
Notes: Ridership data for bus shuttles (which replace streetcars when they are out of service) is included only through December 2021.
Click to expand dashboards below:
Streetcar boardings by line and month
January 2016 – April 2026
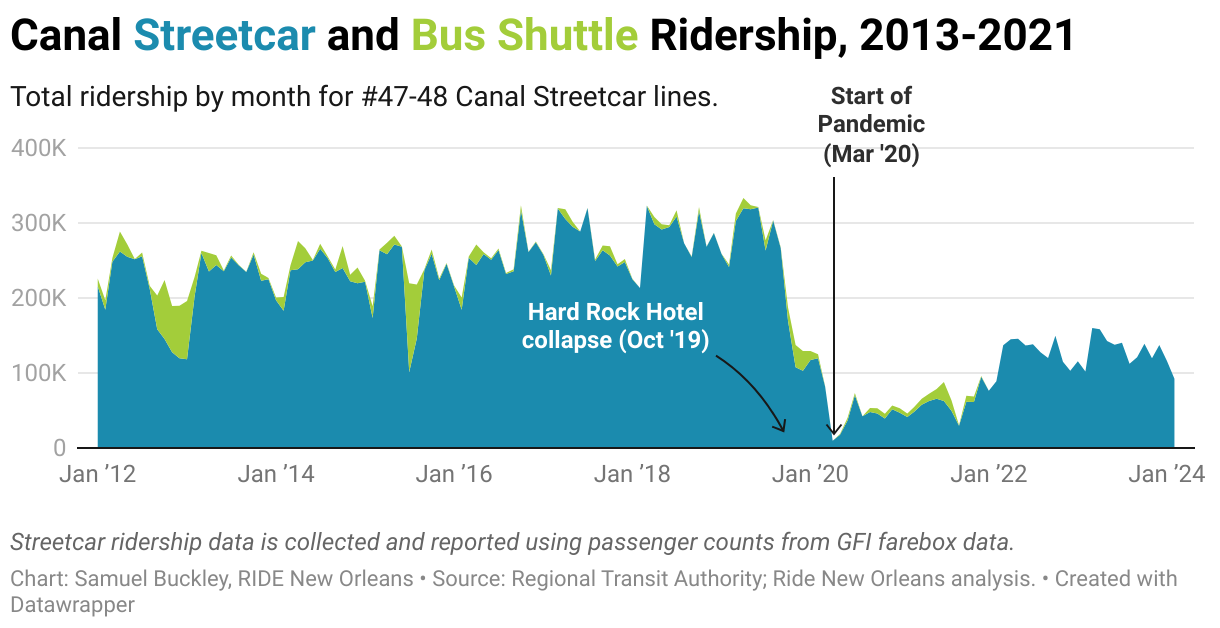
Canal detailed summary
January 2012 – April 2026
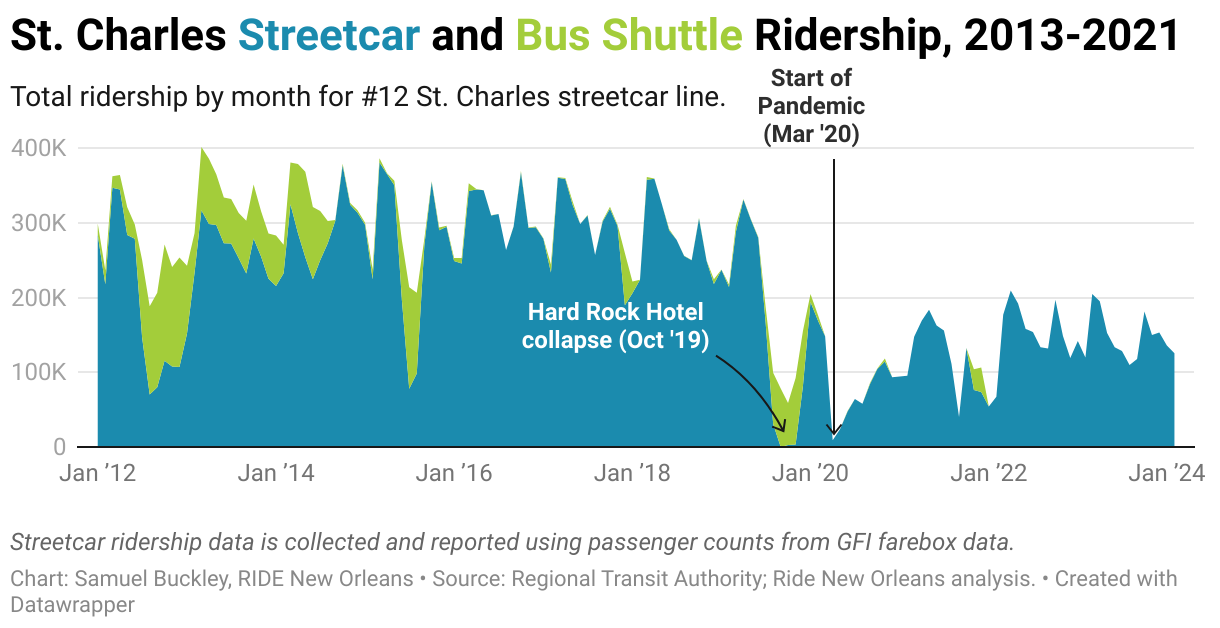
St. Charles detailed summary
January 2012 – April 2026
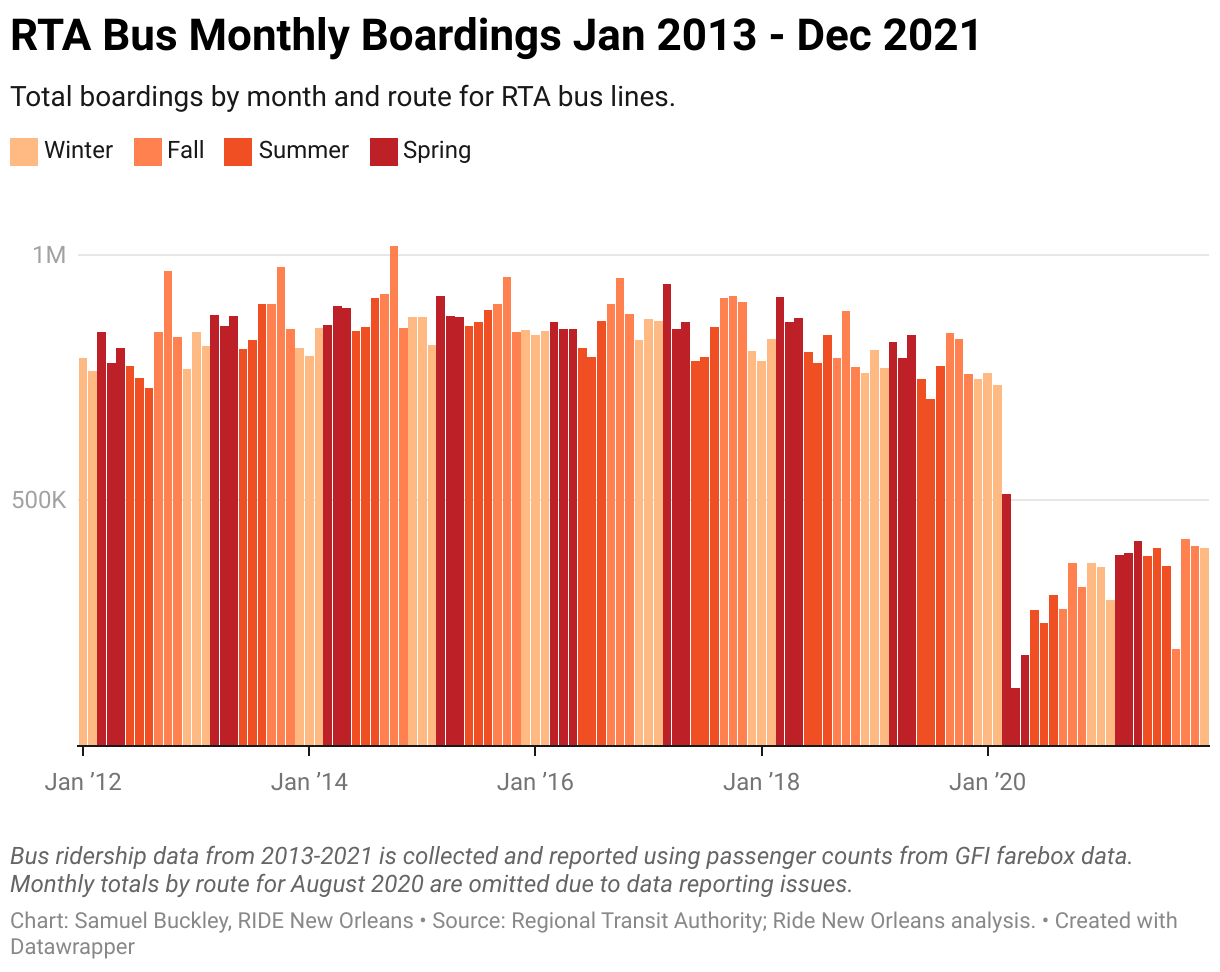
RTA Bus Ridership by Line and Month, Jan 2012 – Dec 2021 (farebox data)
Description: Total monthly bus boardings by line, Jan 2012- Dec 2021.
Note: Combined totals are shown for lines which are branches/variations of a single route (e.g. 51-52 St. Bernard, 114-115 Gen de Gaulle).
January 2012 – December 2021
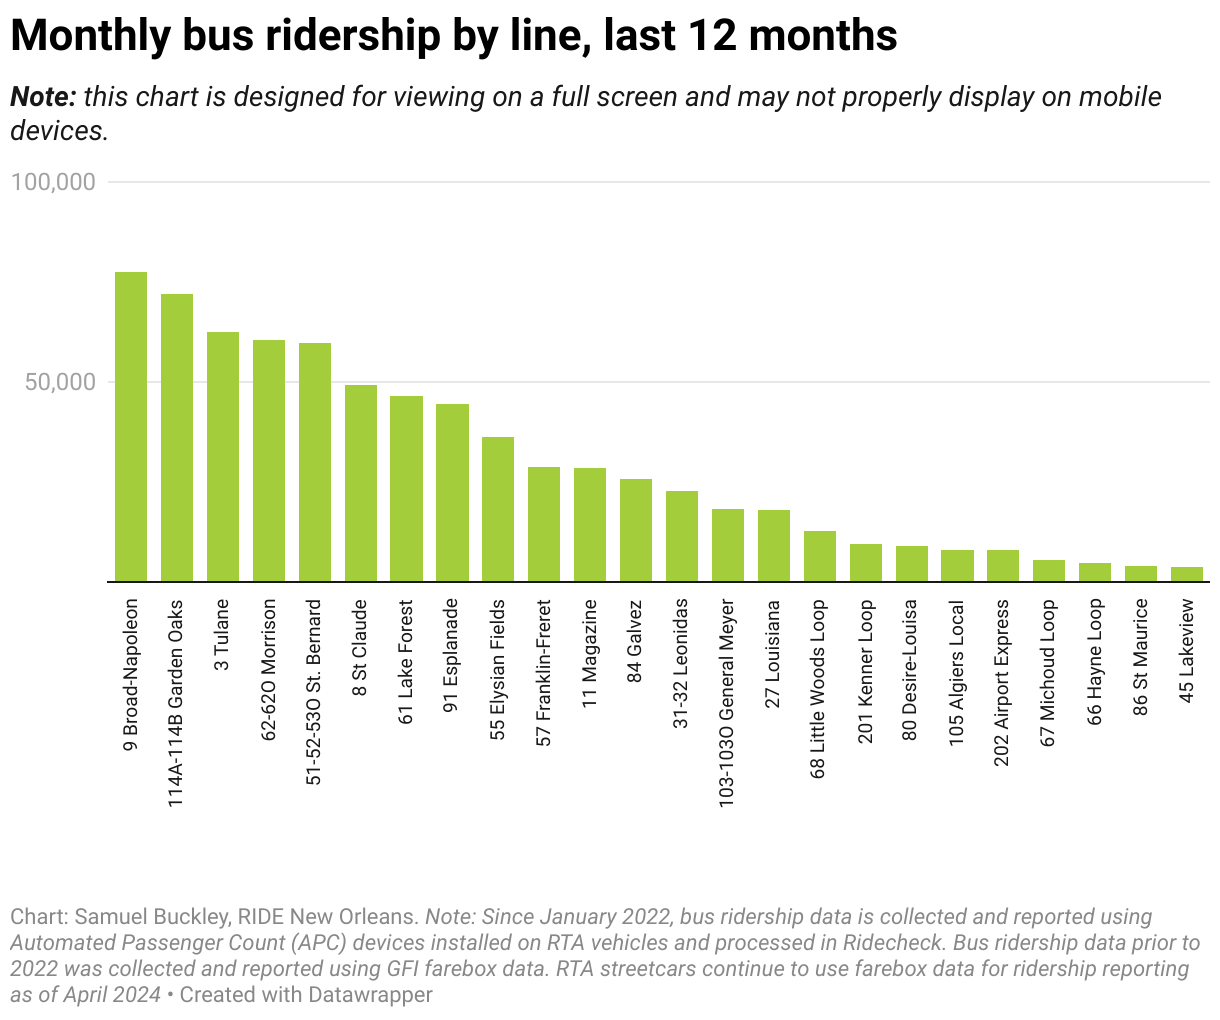
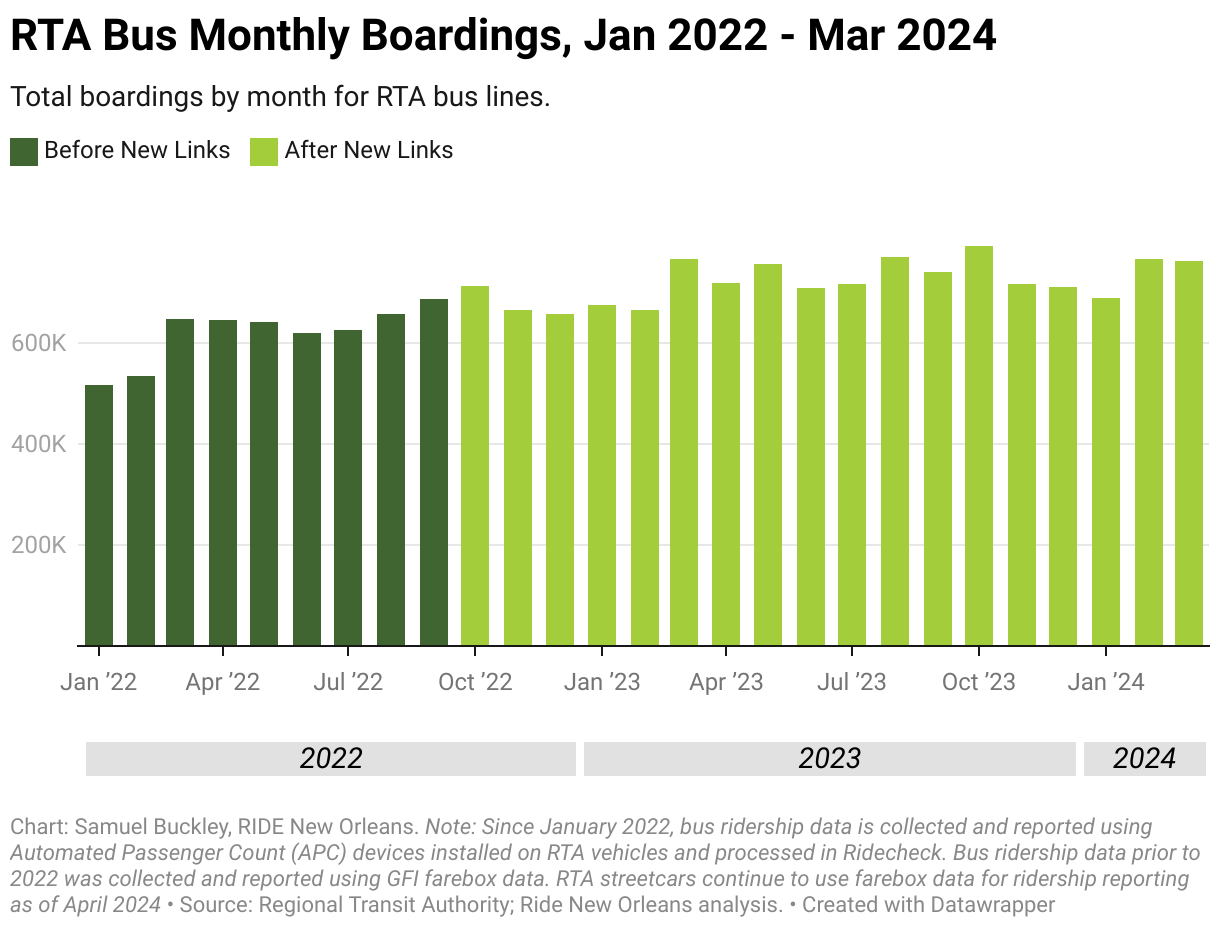
RTA Bus Ridership by Line and Month, Jan 2022 – April 2026 (APC data)
Description: Total monthly bus boardings by line, Jan 2022 – April 2026.
Note: Combined totals are shown for lines which are branches/variations of a single route (e.g. 51-52 St. Bernard, 114 A/B Garden Oaks).
In January 2022, the RTA began reporting bus ridership data using Automated Passenger Counters (APCs) instead of farebox data. Additionally, in October 2022 the RTA implemented the New Links redesign of the New Orleans bus network, which resulted in many new, discontinued, and changed bus routes and names. For those reasons, bus ridership data from 2022 onwards is reported separately from bus totals up to December 2021.
For simplicity and to provide meaningful cross-comparisons of ridership trends before and after New Links implementation, the dashboard below assigns the monthly ridership totals for discontinued routes to the closest equivalent post-New Links route (or group of routes). For example, ridership for the former 39 Tulane bus line is included under the tab for the renumbered #3 Tulane bus. Likewise, ridership for pre-New Links routes which were merged into a single line (such as the 15 Freret and 57 Franklin) is reported under the tab for the merged line. Refer to the crosswalk table below which maps the designations for all old and new bus routes and route groups.
January 2022 - Present
Last 12 Months